OpenCTI #9 - case study
Discover OpenCTI in this series. This last episode will wrap up everything with work on a report

In the last post, we did an introduction to OpenCTI's Python API library. This is the last post of this series covering OpenCTI and it will wrap everything we saw in previous episodes.
I selected a report from Trustwave because I think it covers extensively a specific piece of malware that will allow us to cover many objects. You will find the PDF report here: https://www.trustwave.com/hubfs/Web/Library/Documents_pdf/FaceBook_Ad_Spreads_Novel_Malware.pdf
Accelerating the process using the Workbench
You can see that there is a lot of information in this report which goes in depth into the subject. The idea is to represent a maximum in a minimum of time and effort. OpenCTI can assist you using pattern matching (and AI in Entreprise Edition >= 6.0.0).
We will first go in the data import tool (remember, you will find it at the top right of the screen) and import our PDF file. Once the import document connector has finished to work, we can open the created workbench:
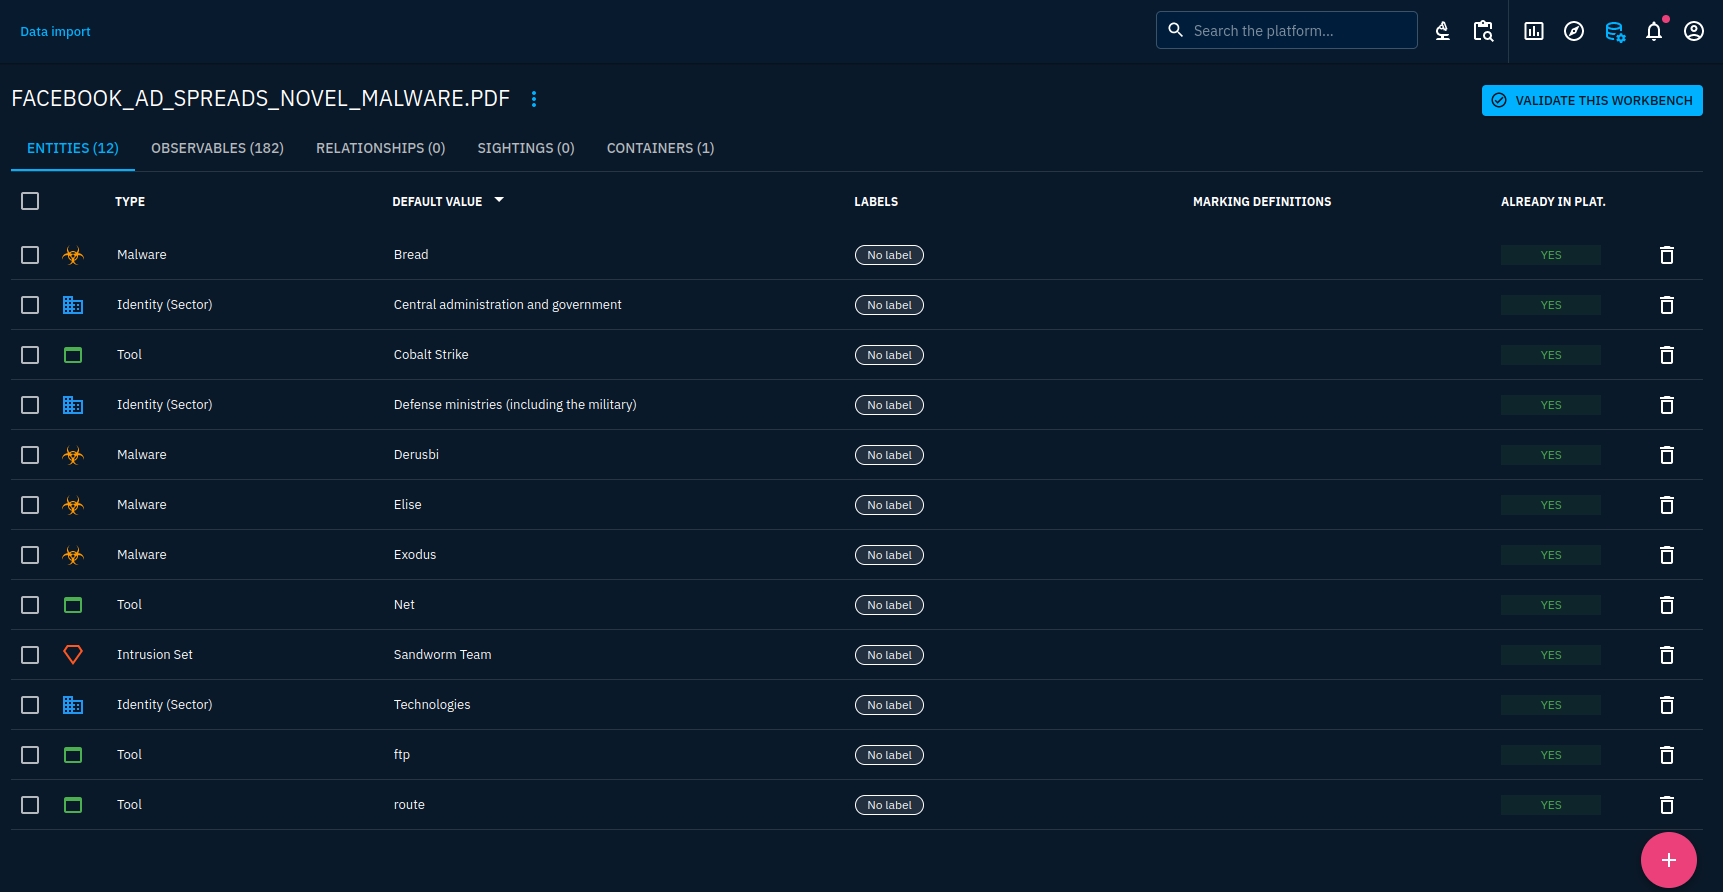
You will notice that a lot of data will be inconsistent. It will be our job to improve that a little bit. Just cut inconsistent data by removing it from the workbench. It is not actually committed to the platform yet so don't be afraid to do something wrong here. To find inconsistencies, contextualize information with the report content.
For example, the Bread malware has been identified by pattern matching (because the malware Bread is known in the Att&ck framework which was imported through a connector). However, when we look for Bread into the report, it is indicated that Bread is a browser extension targeted by the malware Ov3r_Stealer reported here. That is why, I will remove it.
You will notice that we have more than 180 observables imported. That is interesting because we won't have to work manually with each hash, IP address or other observable to make sure it is included. But the report lists several hashes for a same file so we will have to merge some later. Moreover, observables are listed for any pattern that matched, including URLs such as the ones from the reporter.
We have limited functionalities in the workbench, so we will only filter out the data that is inconsistent. We'll add relationships and refine the objects into the report view after validating the workbench.
I will just modify the report object to have the right metadata associated with the report after creation:
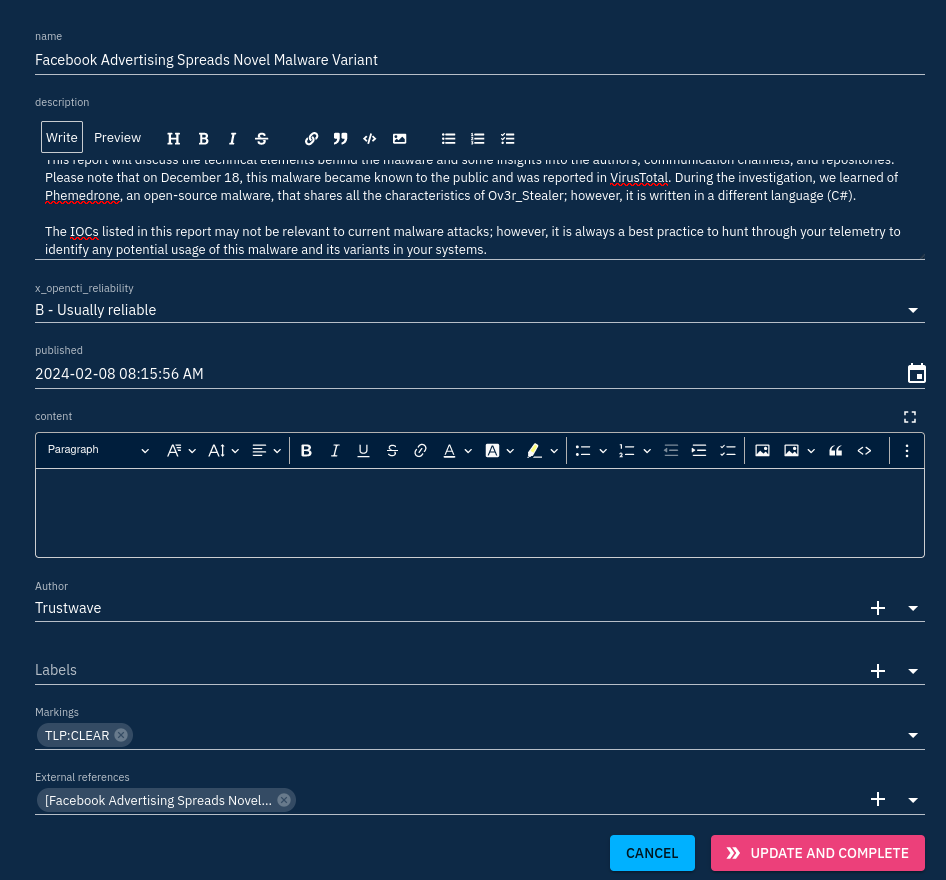
All objects in the workbench will be automatically added to the report container after validation. You can have a preview of what will be included in the list displayed after clicking on "Update and complete".
Editing the report
When we're happy with the contents, let's validate the workbench. Import will take some time, when finished, you will find the new report under the Reports menu.
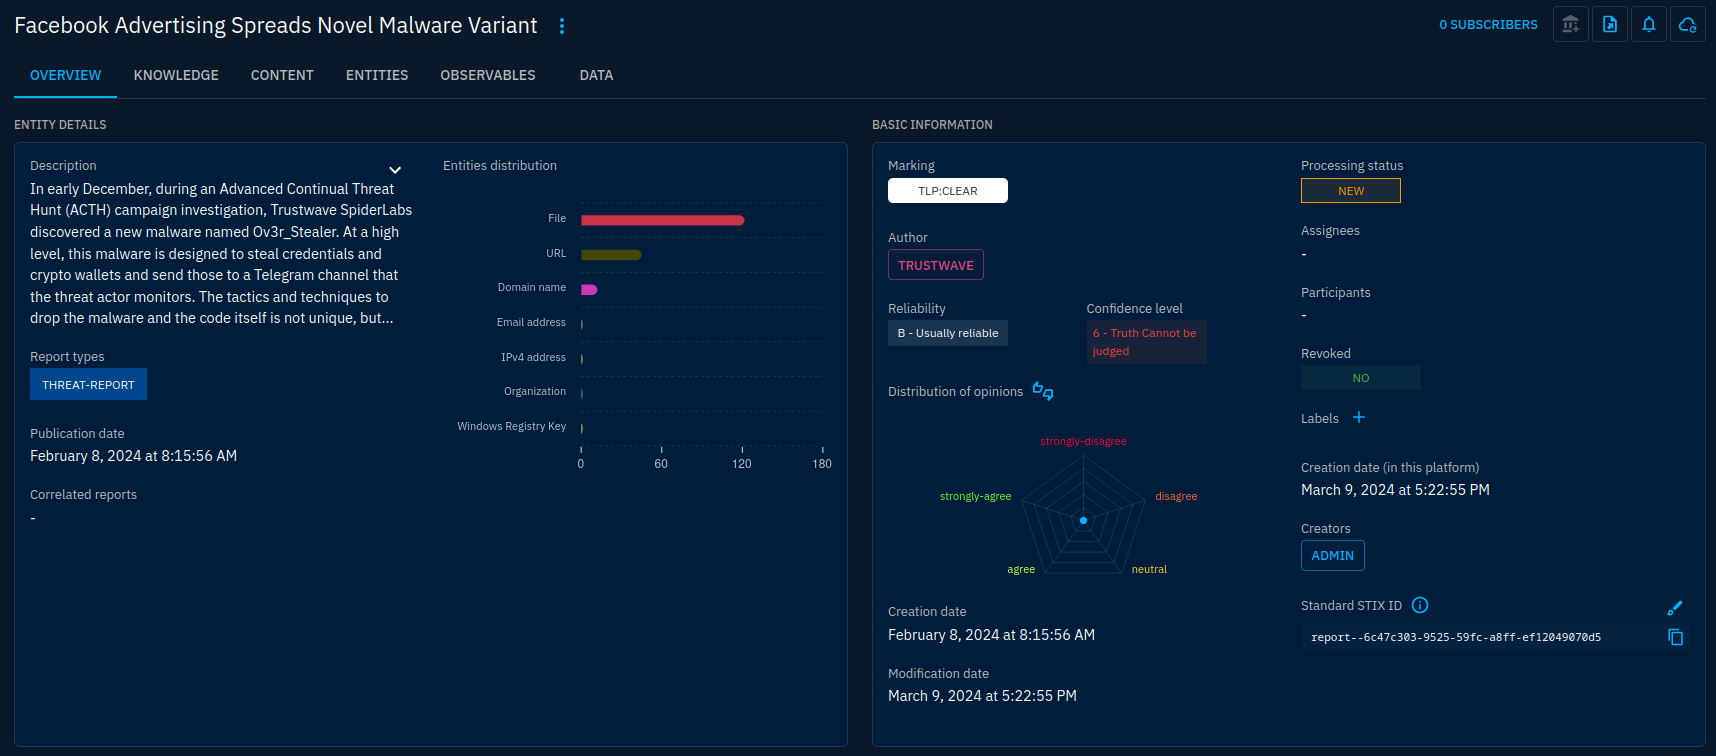
I will set the confidence to "Probably True" as I find the data well-reported and backed by evidence. This will be applied as the default confidence for all new objects.
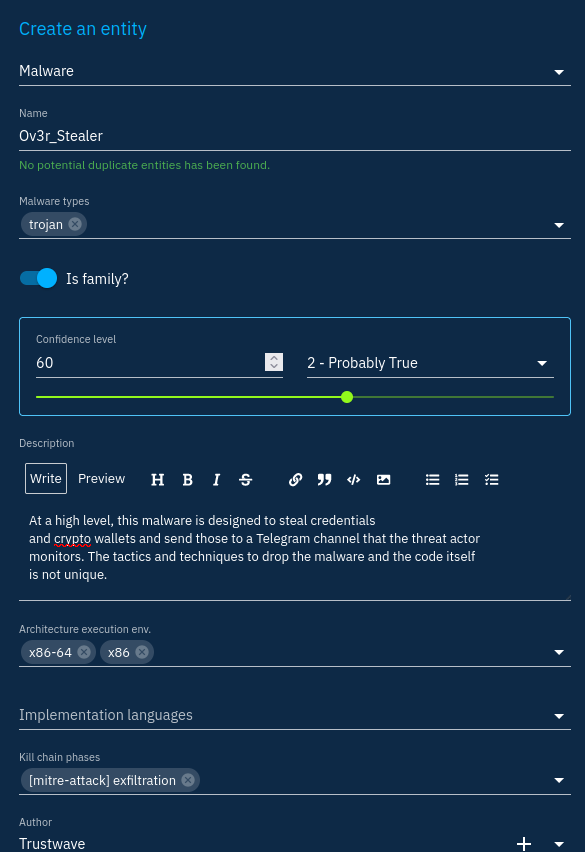
We want to have structured data and indicators when relevant. So we have a bit more work to do. One of the most important objects to have here is the Ov3r_Stealer malware object. After all, this is what this report is all about. I will create it in the knowledge tab to directly add it to the report:
I will then go through the actual report to find any mention that will allow me to create associated information in structured format : Attack Patterns, Campaigns, Intrusion Sets and Threat Actors mostly. Then, I will link the created objects between them to represent how they interact with each other: indicates, uses, targets, communicates-with, etc.
Honestly, this is a bit tedious. You can leverage some hacks to make your job easier. Here are some I used for this report.
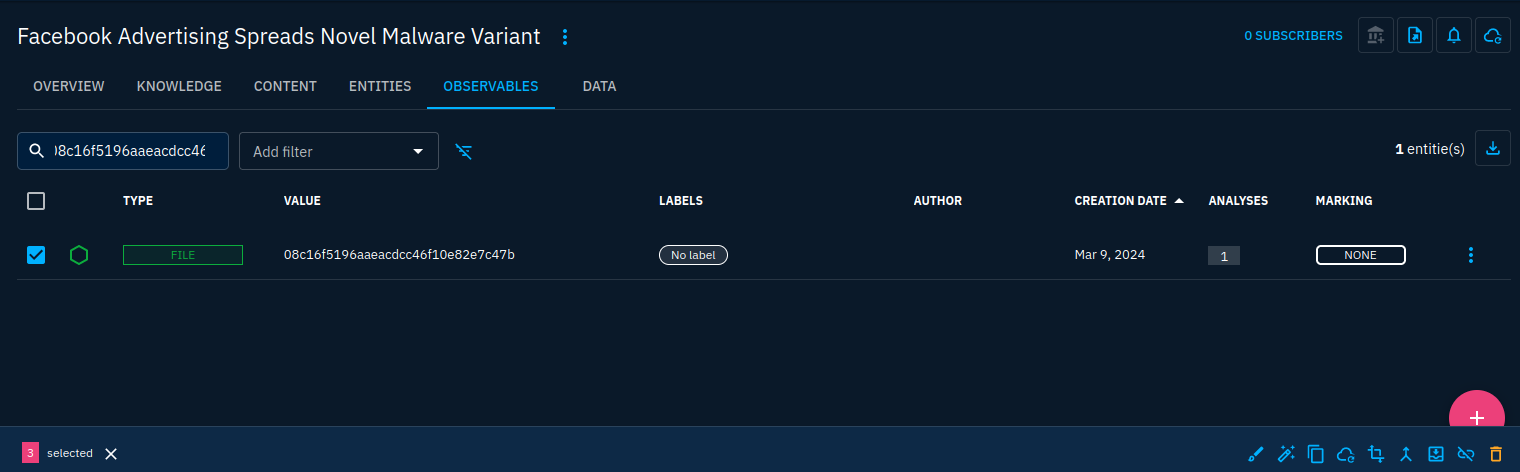
As I said earlier, observables were created from pattern matching. As is, the objects created can be several to represent a same object in fact. Let's take the example of CX.txt which is reported to have the following MD5 and SHA-256 hashes respectively: 08c16f5196aaeacdcc46f10e82e7c47b and cb58bf466675be9e11cfb404503cb122514f47b9708d033e381f28a60535812c. 3 observables have been created for the same file: one with the file name, one with the MD5 hash and one with the SHA-256 hash. Let's get them in a unique observable object.
First, look for the 3 objects and select them one after another. Then click the merge button on the bottom right of the screen as we already did before in this guide.
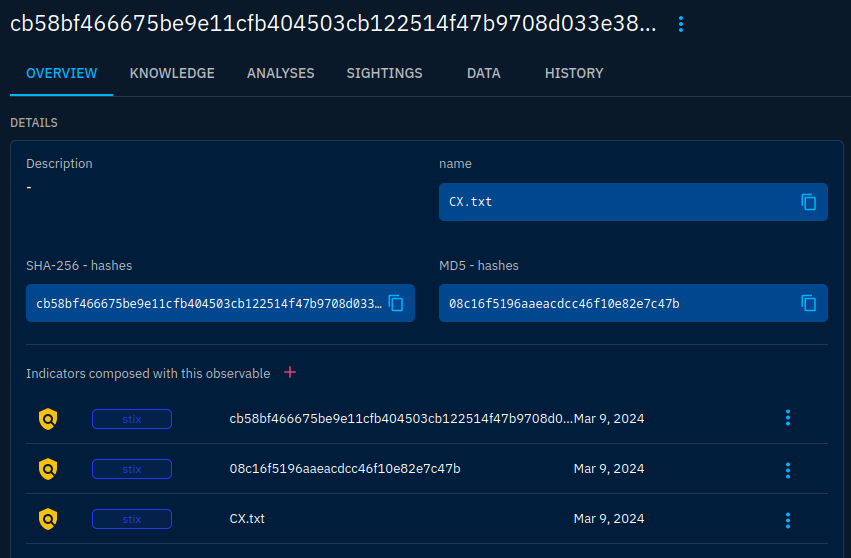
This will merge the properties of all observables into a single one:
I'll also do bulk changes, such as applying the right TLP and confidence to all objects:
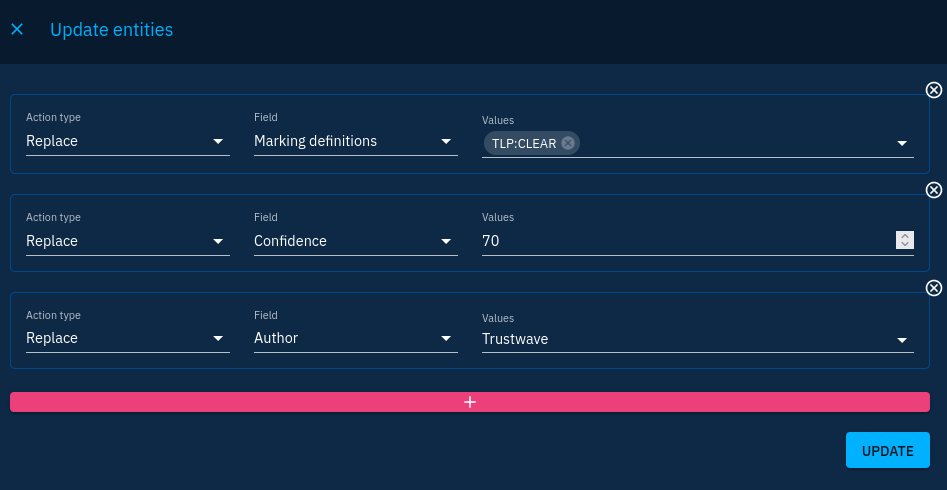
But here are the limits of what I can do in the UI directly. I also want to have indicators in my report to link them to the malware. Moreover, I want indicators to have validity dates consistent. I can do all at once using a Python script using the API as we seen in last chapter:
import pycti
import datetime

OPENCTI_URL = "http://opencti:4000" # Your OpenCTI base URL
OPENCTI_TOKEN = "6b31e648-31fb-4e99-a931-597fab0f0eca" # Your OpenCTI token

opencti_client = pycti.OpenCTIApiClient(OPENCTI_URL, OPENCTI_TOKEN)

# Set your own report ID
report_id = "report--6c47c303-9525-59fc-a8ff-ef12049070d5"

report = opencti_client.report.read(id=report_id)

# Iterate over objects included in the report
for obj in report["objects"]:
    # We only are interested in observable objects that we can use for indicators
    if obj["entity_type"] in ["StixFile", "Domain-Name", "Url", "IPv4-Addr"]:
        # Here's a catch. OpenCTI already created the indicators when we imported the Workbench, we just have to get them
        # First get relationships for the indicators based-on the observable
        relationships = opencti_client.stix_core_relationship.list(
            relationship_type = "based-on",
            toId= obj["id"]
        )
        for relationship in relationships:
            # Update relationship's confidence to 70
            opencti_client.stix_core_relationship.update_field(
                id=relationship["id"],
                input={
                    "key": "confidence",
                    "value": "70"
                }
            )
            # The relationship returned contains the indicator's ID
            # Update indicator's confidence to 70
            opencti_client.stix_domain_object.update_field(
                id=relationship["from"]["id"],
                input={
                    "key": "confidence",
                    "value": "70"
                }
            )
            # Update indicator's validity, let's say 3 months
            opencti_client.stix_domain_object.update_field(
                id=relationship["from"]["id"],
                input={
                    "key": "valid_until",
                    "value": (datetime.datetime.now() + datetime.timedelta(days=90)).strftime('%Y-%m-%dT%H:%M:%SZ')
                }
            )
            # Update indicator's type
            opencti_client.stix_domain_object.update_field(
                id=relationship["from"]["id"],
                input={
                    "key": "indicator_types",
                    "value": ["malicious-activity"]
                }
            )
            # Add the relationship and the indicator to the report
            opencti_client.report.add_stix_object_or_stix_relationship(id=report["id"], stixObjectOrStixRelationshipId=relationship["from"]["id"])
            opencti_client.report.add_stix_object_or_stix_relationship(id=report["id"], stixObjectOrStixRelationshipId=relationship["id"])
At this moment we have all indicators and observables well-connected and included in the report. We still have to link them to the malware object to have the indicates relationship in the platform. To do that, we can select objects by type in the knowledge graph:
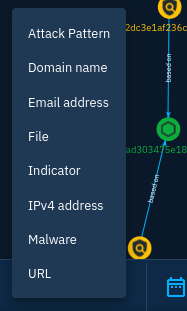
With all indicators selected, we can look for the malware object which interests us in the graph and select it with the group of indicators by CTRL-clicking it. After that we click on the relationship creation button at the bottom-left of the screen and we can enter the information related to the relationships once. It will then create 100 relationships or so at once from all indicators to the Ov3r_Stealer malware object.
This is where the graph starts to consume computing resources on your client device just to be displayed. If you're short on resources, reduce the number of indicators contained in the report.
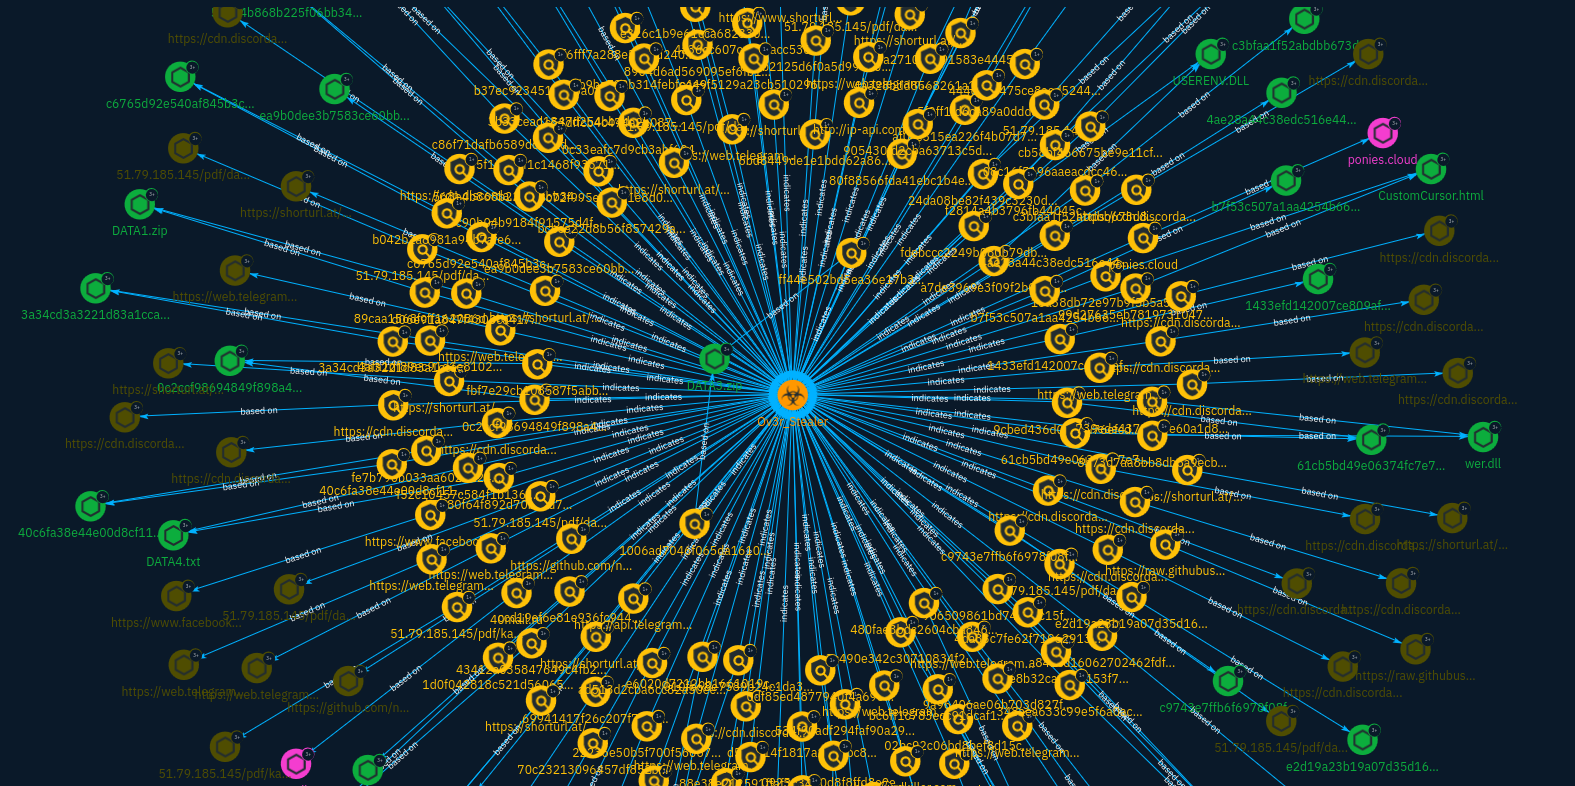
After a few more reading, the graph resembles this:
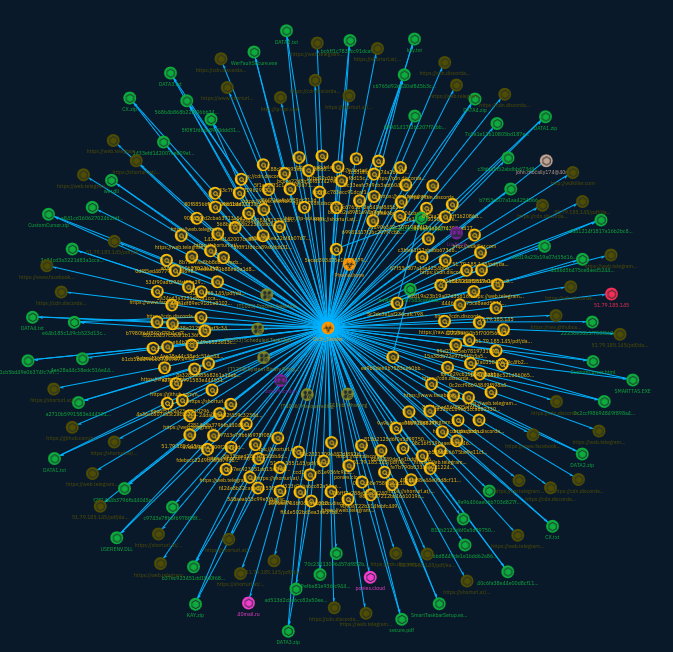
I've took some shortcuts in this analysis and some things may be inaccurate, but indicators are now contextualized and allow analysts who got a match to get context regarding Ov3r_Stealer. They can then pivot on other objects to hunt in more depth.
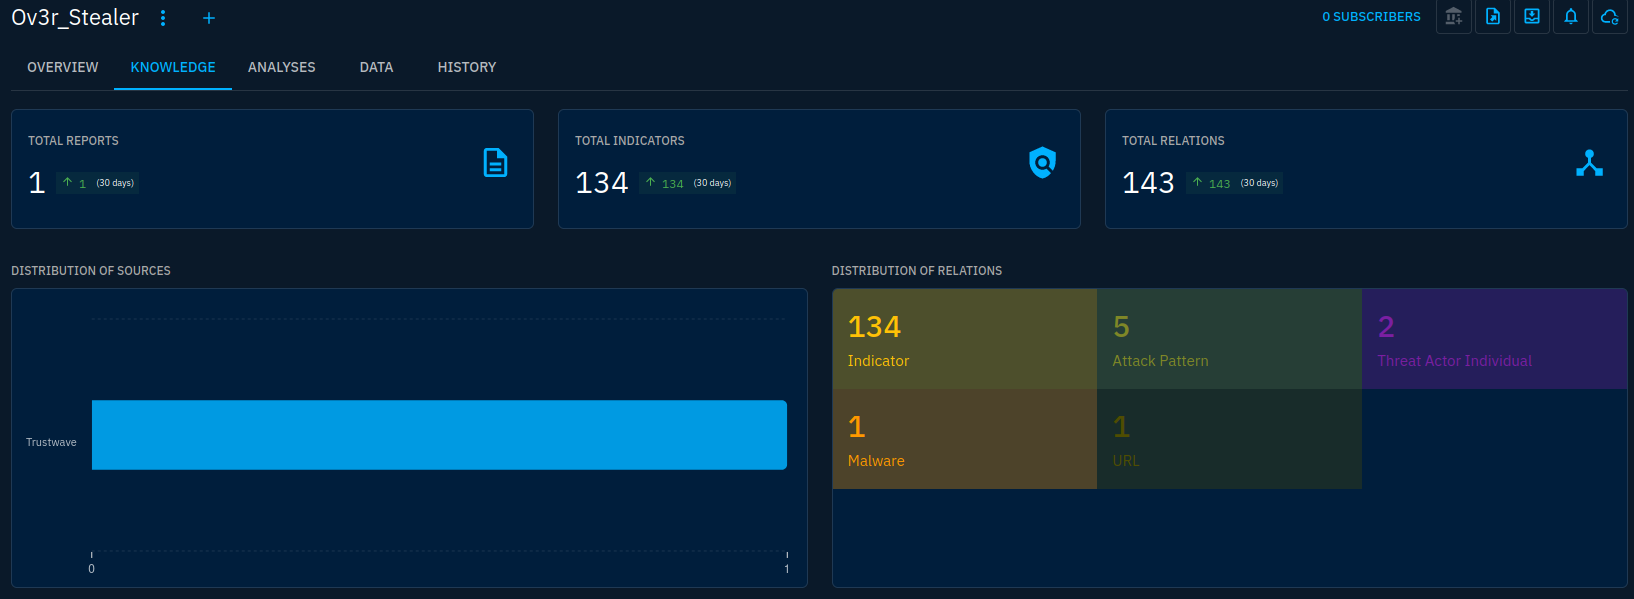
Knowledge can also be reached from the objects themselves. Here from the Ov3r_Stealer malware object:
We also can generate a STIX bundle from the report object for sharing:
Try to import this STIX file 😀
Parting thoughts
We did a bit more than scratching the surface in this series but there is still more to say. I hope this was useful as an introduction to OpenCTI. You can go further by reading the whole OpenCTI documentation.
In my opinion, OpenCTI is a product that gets better really fast. This tutorial may not be accurate in a few months and many pain points that I encountered before have been addressed since. This is also true for the documentation which, even if still not complete today, has seen great improvements.
Moreover, the community is alive and since the platform has gone under the watch of Filigran professional development is taking place to get the features even further. I'm excited to see future development of the platform.