OpenCTI #5 - Reports, groupings, cases
Discover OpenCTI in this series. This fifth post will discuss reports, cases and more generally containers.
In the last post, we saw how to connect the platform with the outside world. Let's dive into another important set of features: containers.
In the STIX standard
When reading the STIX standard, we see some special STIX Data Objects:
- Groupings
- Reports
Moreover, OpenCTI also defines Incident Responses, objects not specified in the standard.
All those 3 object types are considered containers because they can gather other STIX objects by references in a list (i.e. without any tie due to SROs). Containers can contain SDOs, SROs and SCOs all at once.
This allows to group data and make the transition between data formatted in the STIX standard and formats aimed at humans. Typically, a report on a specific subject will contain all data related to the human-readable report and the subgraph contained by the report is also part of the global knowledge.
You can choose a type between a report and a grouping by referring to the STIX documentation:
A Grouping object explicitly asserts that the referenced STIX Objects have a shared context, unlike a STIX Bundle (which explicitly conveys no context). A Grouping object should not be confused with an intelligence product, which should be conveyed via a STIX Report.
OpenCTI has the same approach for Incident Response objects (but with a notion of task management on top of it).
In the platform
Even if they are different conceptually, reports and grouping will have similar properties. We'll only review the report object in the following section, keep in mind that the process is similar in the grouping object.
For this example, we will use Mandiant's report on APT1 activities that is also given as an example report by STIX. This will allow us to walk through the import and report functionalities and have an idea of what a finished report actually looks like.
First, go to the Oasis STIX examples page to download the report as a PDF (through Mandiant's website) and as a JSON bundle.
Then, go to the "Data import and analyst workbench" page. You will find a link to it in the top right corner of the screen (look for a database with a gear icon).
This pane allows you to import supported documents. This will depend on the connectors you have installed. On most instances you will find at least ImportDocument (PDF, TXT, HTML), ImportFileStix (JSON, XML), and ImportCSV (CSV).
You can try to import Mandiant's report PDF file using ImportDocument but you will have to create all the relationships and report structure. Fortunately, we have structured data for this report. So let's just import the STIX file we downloaded:
- Click on the little cloud at the right of the "uploaded files" title
- Choose the STIX JSON file
- Go to the "Analyst workbenches" section and select the workbench called after the imported document
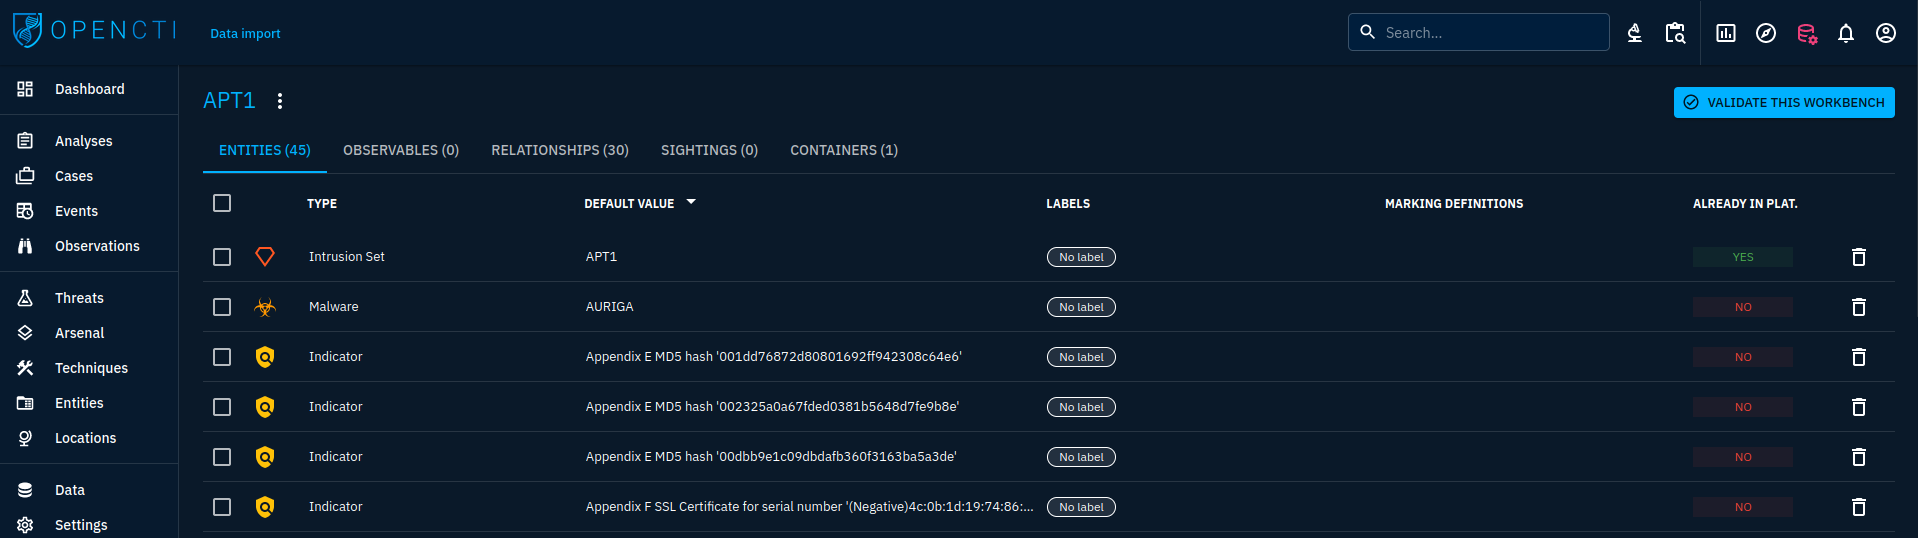
We will not go into details regarding the Analyst Workbench. Just validate it for now and we will work directly in the standard report view.
It will take some time to import but after a few seconds, the report can be accessed in the Analyses -> Reports sub-menu:
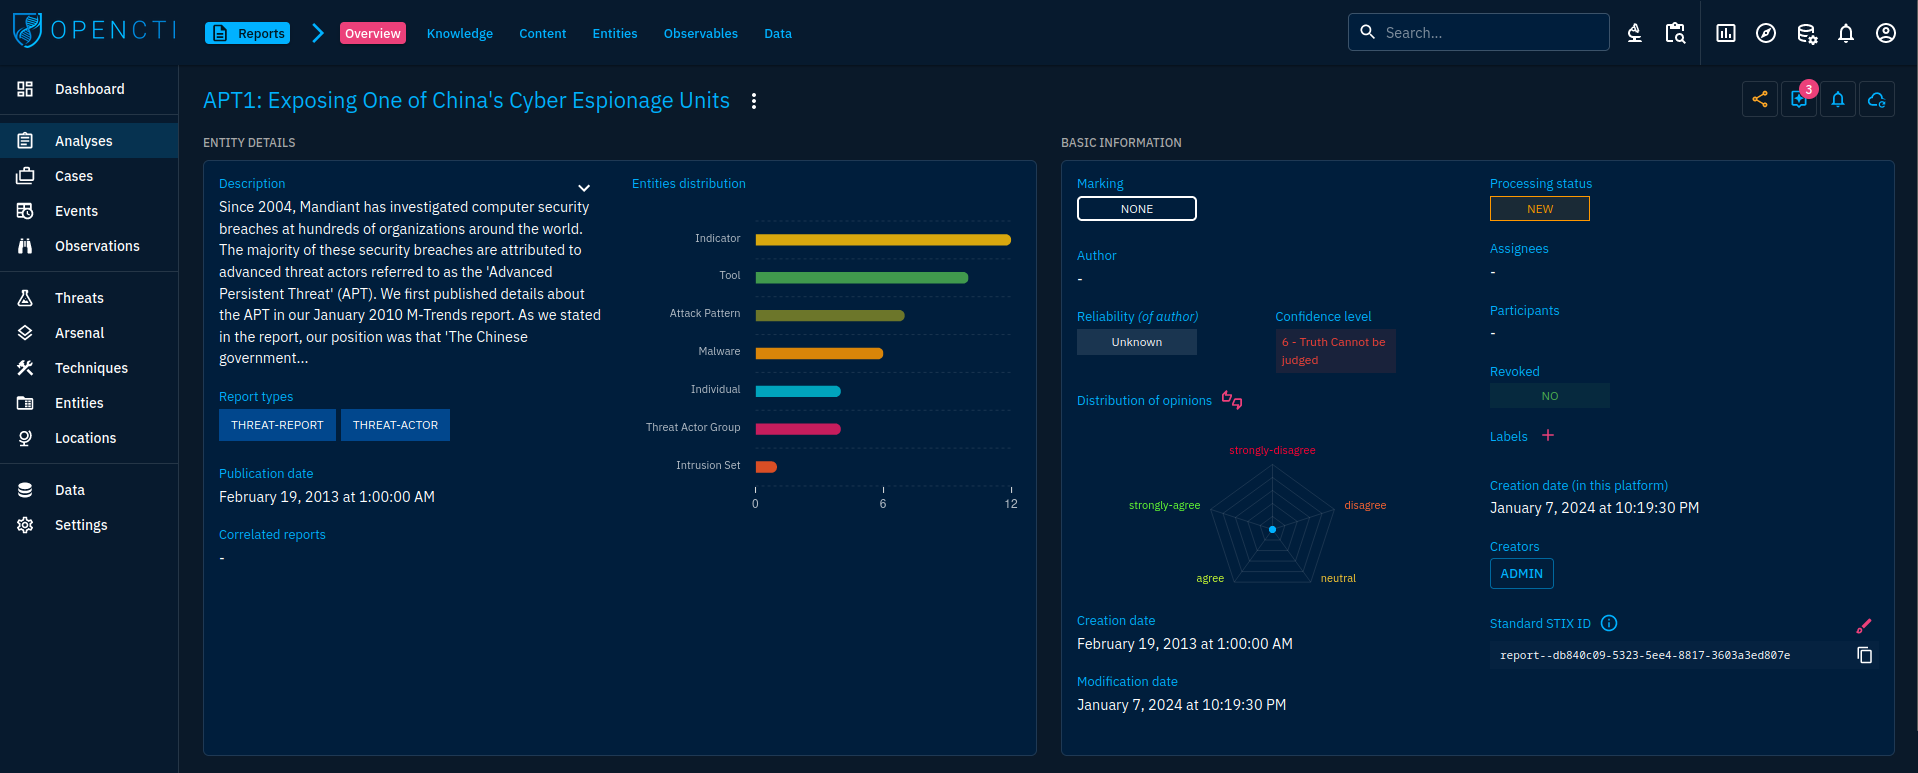
The report overview tab gives insights on the contents of the report:
- A summary
- Distribution of entities by entity type
- Metadata on report processing (processing status, assignees for report management, etc.)
For the exercise, we can add and external reference to the report, pointing to the primary source:
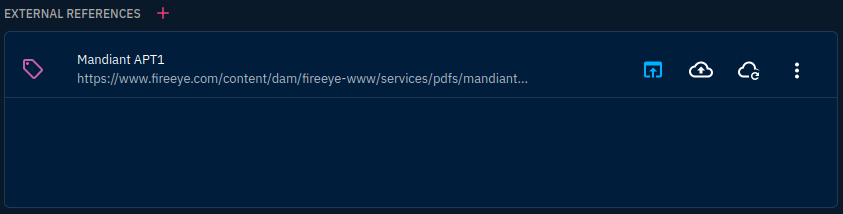
I think that this is a best practice to always specify the primary source of an object as an external reference.
Having an overview is nice but we want to see the actual data. On that matter, the other tabs allow us to go deeper:
- Knowledge: a graph representation of the STIX data contained in the report
- Content: the content of the report, usually verbatim. It allows to keep a copy of the report, even if the original source is taken down
- Entities: a list of the SDOs contained in the report, this tab allows bulk operations on the SDOs
- Observables: a list of the SCOs contained in the report, this tab also allows bulk operations
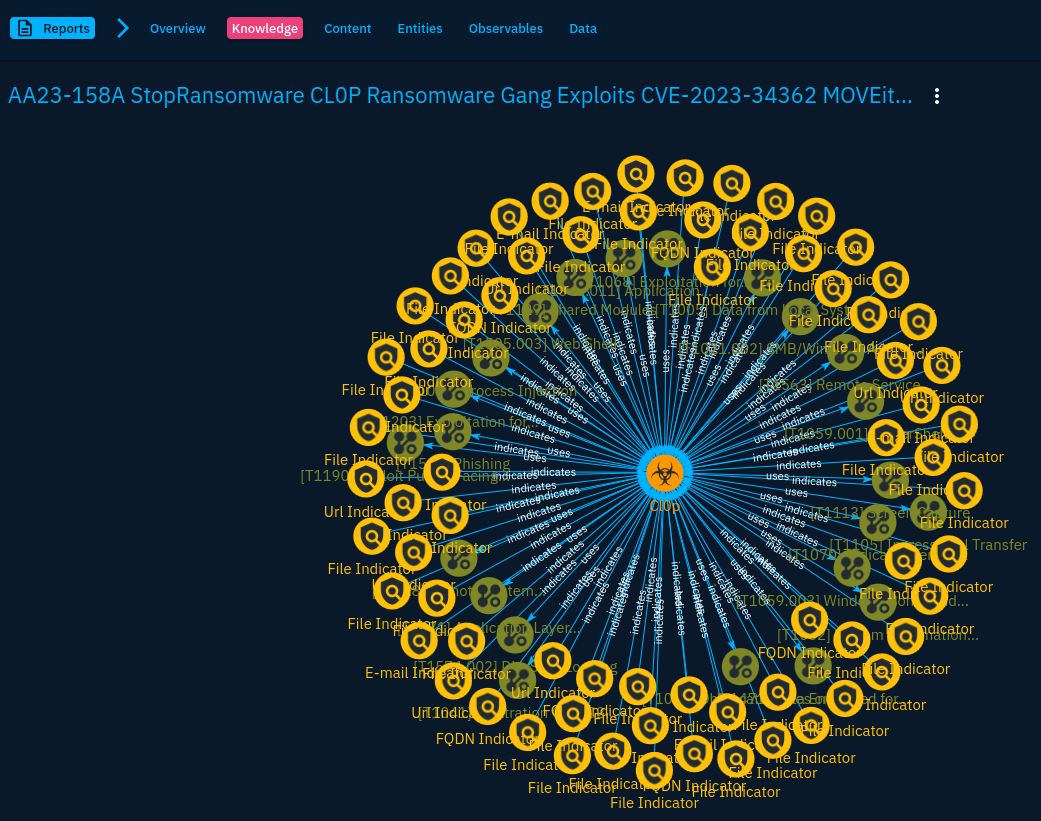
According to me, the most interesting pane of a report is the Knowledge tab where you can visually work on the data contained in the report. In our case, the report looks like this:
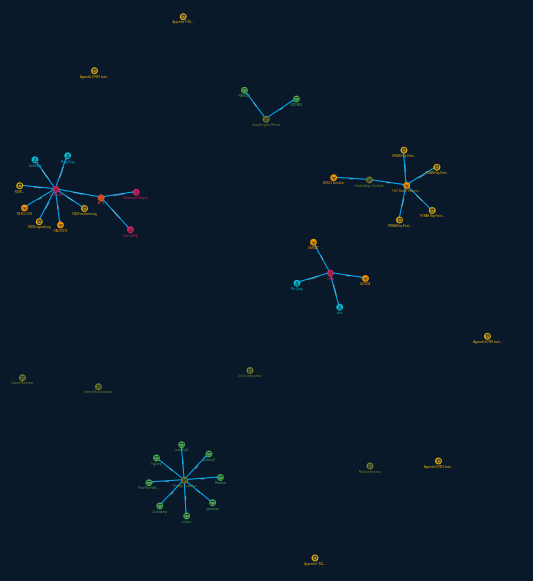
It is possible to select an object (node or relationship) by clicking on it. A pop-up will appear at the right of the graph with a quick overview of the objects selected.
Using CTRL or MAJ allows to select multiple objects at the same time. The pane also have several options to organize, select, and filter data:

From left to right:
- Graph management
- Switch to 3D view
- Organize as a vertical tree
- Organize as an horizontal tree
- Enable/Disable forces (linked nodes will not influence each other)
- Fit to canvas
- Reapply forces (useful when you manually placed nodes and you got lost)
- Selection
- Rectangle select
- Free form select
- Select by entity type (useful when creating relationships between several nodes to one, e.g. indicators to malware)
- Select all nodes
- Filters
- Time range
- Type
- Marking definition
- Author
- Clear
- Text search
On the same bar but aligned right, actions allow to add and create entities. When creating an entity, you have to add it to the report after creation. Try to use the add entity and add relationship features.
As an exercise, try to add the missing relationships and objects. For example, observables related to indicators, relationships between patterns and the intrusion set, etc... This is how you will discover one of the most tedious steps of keeping data consistent in the platform: report handling.
The top-right bar provides more options:

From left to right:
- Sharing management: for Enterprise edition only
- Suggestions: this provides shortcuts to add missing relationships and objects to the graph
- Enrichment: run relevant enrichment connectors on the data
- Various views: these views allow to work on information from other points of view
- Graph view: the one we started from
- Content mapping view: add missing content by selecting text from the description and content of the report. You can also map keywords from the report text to corresponding entities
- Timeline view: provided your dates are correctly specified for each object, the timeline view shows the chronology of events by ordering the objects
- Correlation view: this view allows to check where else the objects have been seen, allowing to correlate different events
- Tactics matrix view: this view maps the TTPs objects observed to a matrix known to OpenCTI, the most common is the MITRE Att&ck matrix
- The graph can also be exported as image or PDF files for the reports you deliver outside OpenCTI
The report content tab allows to store the actual content of the original report. You can upload the PDF file there for example or write your own report in Markdown:
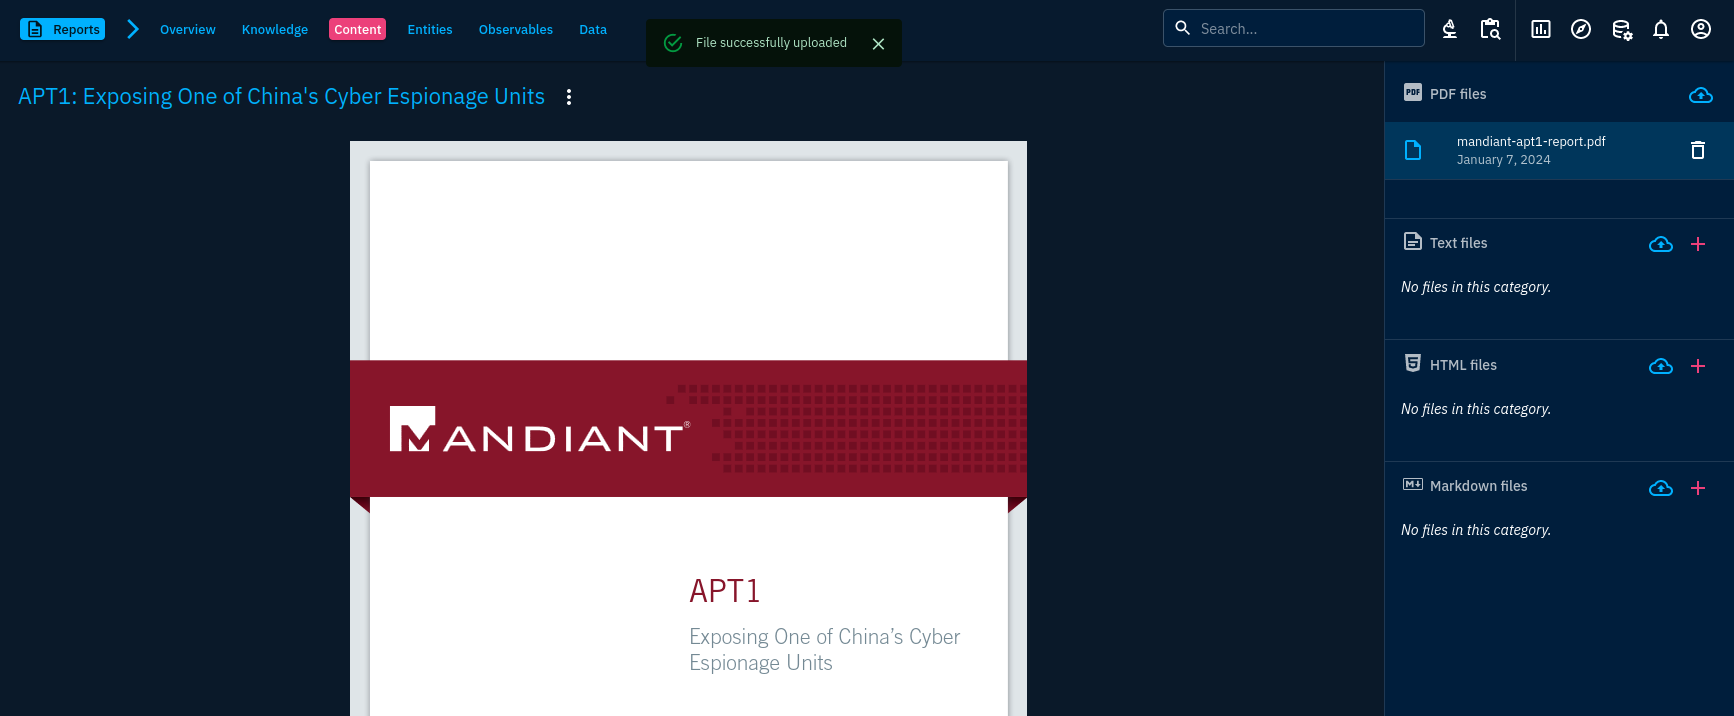
Uploading the PDF file allows to keep a copy of the report even if the report is taken down. This may also be useful if the report has been shared with you by private means. Moreover, uploading the PDF report allows you to conduct pattern matching using the DocumentImport connector. Check the workbench in the Data tab.
Incident response
OpenCTI is not a SOAR. However, it is possible to leverage the Incident Response objects to work as CTI analysts along with incident responders to provide the latter with CTI knowledge and capitalize data from the incident.
For this use case, it is possible to create an Incident Response container. It will work like a report but with team functionalities such as tasks management. Cases can be defined by templates to allow creation of a predefined set of tasks. Templates can be defined in the settings of OpenCTI.
Besides the task and case origin aspects, this container works just like the others.
Conclusion
Containers are the top-level objects one can use in OpenCTI. They allow to gather other objects in a consistent manner in order to consolidate the knowledge on a particular subject. They are the basis of ingestion of external reports but also the skeletons for you own reporting.
In the next episode, we will see how to use the data.